PieChart
Plot a pie chart of std_msgs/Float32 on rviz as HUD overlay.
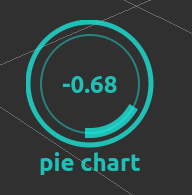
To change caption text, please rename plugin display name on rviz Displays tab
Properties
Topicstd_msgs::Float32topic to subscribe tosizeSize of the plotter window
leftLeft of the plotter window
topTop of the plotter window
foreground colorColor to draw line
foreground alphaAlpha belnding value for foreground
foreground alpha2Alpha belnding value for foreground for indicator
background colorBackground color
background alphaAlpha belnding value for background
text sizeText size
show captionShow caption
max valueMax value of pie chart
min valueMin value of pie chart
auto color changeChange the color automatically
max colorMax color of pie chart
Only used if auto color change is set to True
med colorMed color of pie chart
Only used if auto color change is set to True
max color change thresholdChange the max color at this threshold
Only used if auto color change is set to True
med color change thresholdChange the med color at this threshold
Only used if auto color change is set to True
clockwise rotate directionChange the rotate direction
Sample
roslaunch jsk_rviz_plugins overlay_sample.launch
or
roslaunch jsk_rviz_plugins piechart_sample.launch